Inclusive Strategy Scorecard: summary of key changes between 2019 and 2023
Updated 29 May 2025

© Crown copyright 2025
This publication is licensed under the terms of the Open Government Licence v3.0 except where otherwise stated. To view this licence, visit nationalarchives.gov.uk/doc/open-government-licence/version/3 or write to the Information Policy Team, The National Archives, Kew, London TW9 4DU, or email: [email protected].
Where we have identified any third party copyright information you will need to obtain permission from the copyright holders concerned.
This publication is available at https://www.gov.uk/government/publications/inclusive-transport-strategy-scorecard/inclusive-strategy-scorecard-summary-of-key-changes-between-2019-and-2023
The Inclusive Transport Strategy (ITS) sets out our plans to make our transport system more inclusive and travel easier for disabled people. Our vision is for disabled people to have the same access to transport as everyone else. They will travel confidently, easily and without extra cost.
We commissioned the National Centre for Social Research (NatCen) to carry out an evaluation of the ITS. This scorecard formed part of its overall evaluation and monitored change in metrics relating to disabled people’s travel between 2019 and 2023.
The scorecard consists of a table of 23 different metrics. You can find this on the homepage of this guidance. Here we provide a summary of the key changes across these metrics over the last 4 years. This is intended to be viewed alongside the scorecard table.
The data sources for each metric, as well as further information about the purpose and content of the scorecard can be found in the Inclusive Transport Strategy scorecard: 2022 to 2023 background information page.
Due to a combination of the COVID-19 pandemic and changes to survey content, data collection was not possible for all 23 metrics used in the scorecard in all scorecard years. [footnote 1] Because of this, the 2022 to 2023 scorecard does not display any data for metrics 7 to 10, 15, 16 and 18. [footnote 2]
Summary of key changes: 2019 to 2023
An overall summary of the changes between 2019 and 2023 is presented below for each scorecard metric (this does not include metrics where data was unavailable in the 2022 to 2023 scorecard year). Where data was consistently available in each scorecard year (metrics 1 to 6, 21 and 22) and where significant changes were observed, a chart is provided to illustrate these changes.
Theme 1: access to transport
The average number of trips taken by disabled people across most categories sharply decreased in 2020 to 2021 but increased slightly in 2021 to 2022 and increased again, by a substantially greater degree, in 2022 to 2023.
This trend is consistent with the average number of trips taken by non-disabled people and it is likely that the COVID-19 pandemic and following recovery contributed to these changes.
In the first scorecard year (2019 to 2020), overall, disabled people took 75% of the number of trips taken by non-disabled people. This dropped to 72% in the second scorecard year (2020 to 2021) and remained at 72% in the third scorecard year (2021 to 2022), before it eventually returned to 75% in the final scorecard year (2022 to 2023). However, this changes when looking at different age groups.
Overall, the gap between disabled and non-disabled people aged 16 to 59 decreased whereas for those aged 60 and above it increased.
Disabled people aged 16 to 59 took 83% of the number of trips taken by non-disabled people in the first scorecard year and this increased to 86% in the final scorecard year.
For those aged 60 and above, this started at 69% and reduced to 65%. Theme 1 represents metrics 1 to 6 of the scorecard. [footnote 3]
Chart 1: mean number of trips taken annually by disabled and non-disabled people, between 2018 and 2023
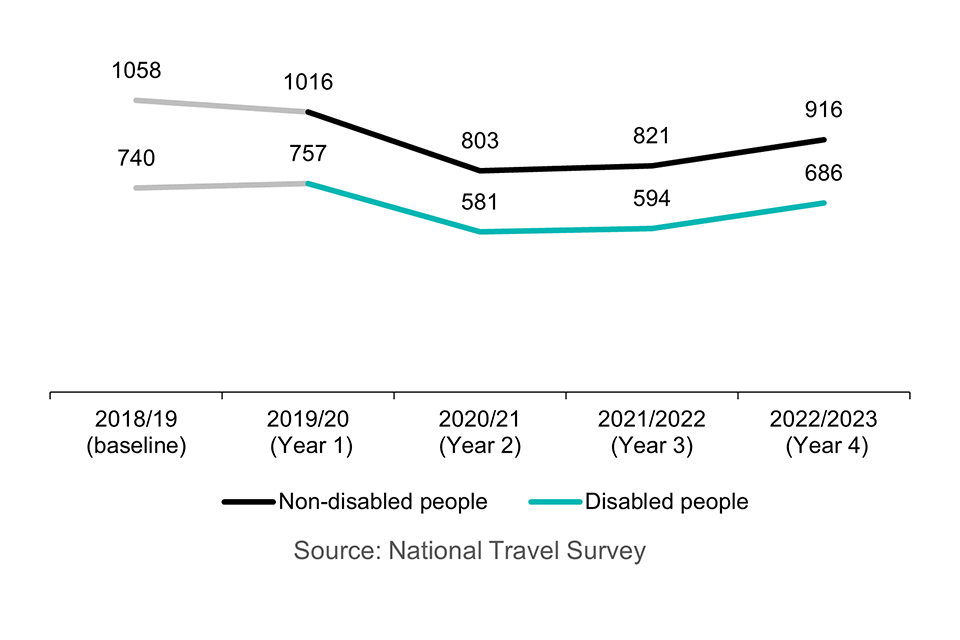
Chart 2: mean number of trips taken annually by disabled and non-disabled people (age 16 to 59), between 2018 and 2023

Chart 3: mean number of trips taken annually by disabled and non-disabled people (age 60 or over), between 2018 and 2023

Theme 2: travelling experience
Satisfaction among disabled people with motorways and major ‘A’ roads showed a slight overall decrease between 2019 and 2023.
In the first scorecard year (2019 to 2020) this was 76% and in the last scorecard year (2022 to 2023) it was 72%.
Theme 2 represents metrics 11[footnote 4] and metric 12[footnote 5] of the scorecard.
Theme 3: complaints
For trains, the percentage of passenger complaints that were accessibility related remained broadly consistent overall. In the first scorecard year (2019 to 2020) this was 1.2% and in the last scorecard year (2022 to 2023) this was 1.5%.
For buses, this also remained broadly consistent. In the first scorecard year (2019 to 2020) this was 5%. It rose to 7% in the second scorecard year (2020 to 2021) before falling to 4% in the last scorecard year (2022 to 2023).
Theme 3 represents metrics 13 and 14 of the scorecard [footnote 6].
Theme 4: interactions with transport staff
The ITS aims to ensure that staff interactions become more consistent. Feedback from the government’s Accessibility Action Plan consultation in 2017 suggested that providing effective training to transport staff is likely to improve the travelling experience of disabled passengers. Positive interactions with staff can help build the confidence of disabled people to travel.
Theme 4 draws on the following metrics:
- metric 15: percentage of disabled people who were satisfied with the helpfulness and attitude of the bus driver on their journey (source: Bus Passenger Survey)
- metric 16: percentage of disabled people who thought the helpfulness and attitude of staff on their train was very/fairly good (source: National Rail Passenger Survey)
It was not possible to obtain this data for the 2021 to 2022 scorecard due to the changes to data collection timeframes[footnote 1] that followed the COVID-19 pandemic.
Theme 5: assistance
The percentage satisfied with the passenger assistance on trains slightly increased in 2020 to 2021 and again in 2022 to 2023.
In the first scorecard year (2019 to 2020) this was 86% and in the last scorecard year (2022 to 2023) this was 90%.
Theme 5 represents metric 17 of the scorecard [footnote 7].
Theme 6: accessible vehicles
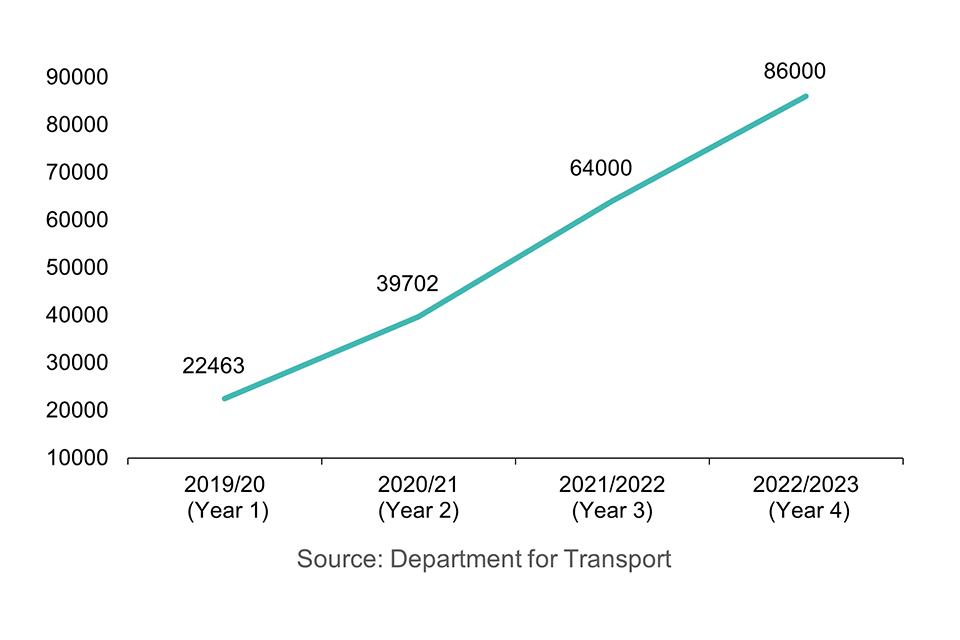
The number of blue badges held by people with non-visible disabilities increased considerably overall and by a similar amount year on year.
In the first scorecard year (2019 to 2020) this was 22,463 and in the last scorecard year (2022 to 2023) this was 86,000. The percentage of taxis that were wheelchair accessible slightly decreased overall, while for PHVs this remained consistent.
In the first scorecard year (2019 to 2020) this was 57% of taxis and 2% of PHVs.
In the last scorecard year (2022 to 2023) this was 55% of taxis and 2% of PHVs.
Theme 6 represents metrics 19 to 20[footnote 8] and metric 21[footnote 9] of the scorecard.
Chart 4: number of blue badges held by people with non-visible disabilities, between 2019 and 2023
Theme 7: information
The percentage of local service buses that provided audible and visible information onboard increased by a similar amount year on year.
In the first scorecard year (2019 to 2020) this was 38% and in the last scorecard year (2022 to 2023) this was 47%.
Theme 7 represents metric 22 [footnote 10].
Chart 5: percentage of buses on local services on which audible and visible information is provided, between 2016 and 2023

Theme 8: interactions with other passengers
The percentage of people who would give up a seat for someone with an illness, impairment or condition that makes it more difficult to use public transport fluctuated between 91% and 94%.
In the first scorecard year (2019 to 2020) this was 91% and in the last scorecard year (2022 to 2023) this was 93%.
Theme 8 represents metric 23 of the scorecard [footnote 11].
It should be noted that the observed changes cannot be attributed to ITS actions, although ITS actions may have played a role.
It should also be noted that where subjective measures such as passenger satisfaction have only increased by one or 2 percentage points, they may not represent a material improvement but rather marginal fluctuations between data collections.
-
Certain surveys were paused following the onset of the COVID-19 pandemic, due to significant reductions in the numbers of people using public transport or because it was not safe enough to conduct face-to-face interviews. For 2 of these surveys, (metrics 11 and 12), data collection was resumed in the 2021 to 2022 and 2022 to 2023 financial year (respectively). Bus passenger survey (metric 15) was discontinued and replaced by an equivalent survey Your Bus Journey, but data collection started outside of the 2022 to 23 financial year. Finally, the National Rail Passenger Survey (metric 16) also did not run in the 2022 to 2023 financial year as it was discontinued. ↩ ↩2
-
Certain surveys either did not feature or report on the relevant questions drawn on by the scorecard during the 2022 to 2023 financial year. For this reason, the 2022 to 2023 scorecard does not display any data for metrics 9 to 10 or 18, which draw on the Maritime and Coastguard Agency Disabled Passenger Satisfaction Survey and the Aviation Consumer Survey. ↩
-
Metrics 1 to 6 represent data taken from the National travel survey. The survey ran between January and December 2022. It was conducted in England and published by DfT. For metrics 3 to 6 the age split was used on the basis that 60 is the age at which it is possible to start claiming free and discounted travel. ↩
-
Metric 11 represents data taken from the strategic road user survey. The data was collected in England between 1 April 2022 and 31 March 2023. The survey restarted in April 2021 with a new methodology. This means that results prior to March 2020 and from April 2021 are not directly comparable. ↩
-
Metric 12 represents data taken from the Motorway service user survey. This data was collected in Great Britain between 2022 and 2023. It should be noted that data collection was paused following the onset of the COVID-19 pandemic and resumed in 2022, using a new research method. For this reason, the metric 12 data presented for the 2022 to 2023 scorecard year should not be directly compared with previous years. ↩
-
Metrics 13 to 14 represent data taken from Bus Users UK (not in the public domain) and the Office of Rail and Road. Both datasets were collected in Great Britain between 2022 and 2023. ↩
-
Metric 17 represents Passenger Assist data taken from the Office of Rail and Road. The data was collected in Great Britain between 2022 and 2023. ↩
-
Metrics 19 to 20 represent Taxi and Private Hire Vehicle Statistics. The data was collected in England and published by DfT as at 1 April 2023. ↩
-
Metric 21 represents blue badge statistics published by DfT. The data was collected in England and published by DfT as at 31 March 2023. ↩
-
Metric 22 represents local bus operator data held by DfT, as at 31 March 2023. The data was collected in Great Britain. Correction: In certain previous scorecard years, data representing just England was presented for metric 22 in error. This has been retrospectively corrected. ↩
-
Metric 23 represents data taken from the National Travel Attitudes Survey. The survey ran between March and April 2023. It was conducted in England and published by DfT in August 2023. ↩